Product Tour
Inside the operations cockpit
From the live demo on Summit Regional, a synthetic 500-bed health system — click any view to enlarge.
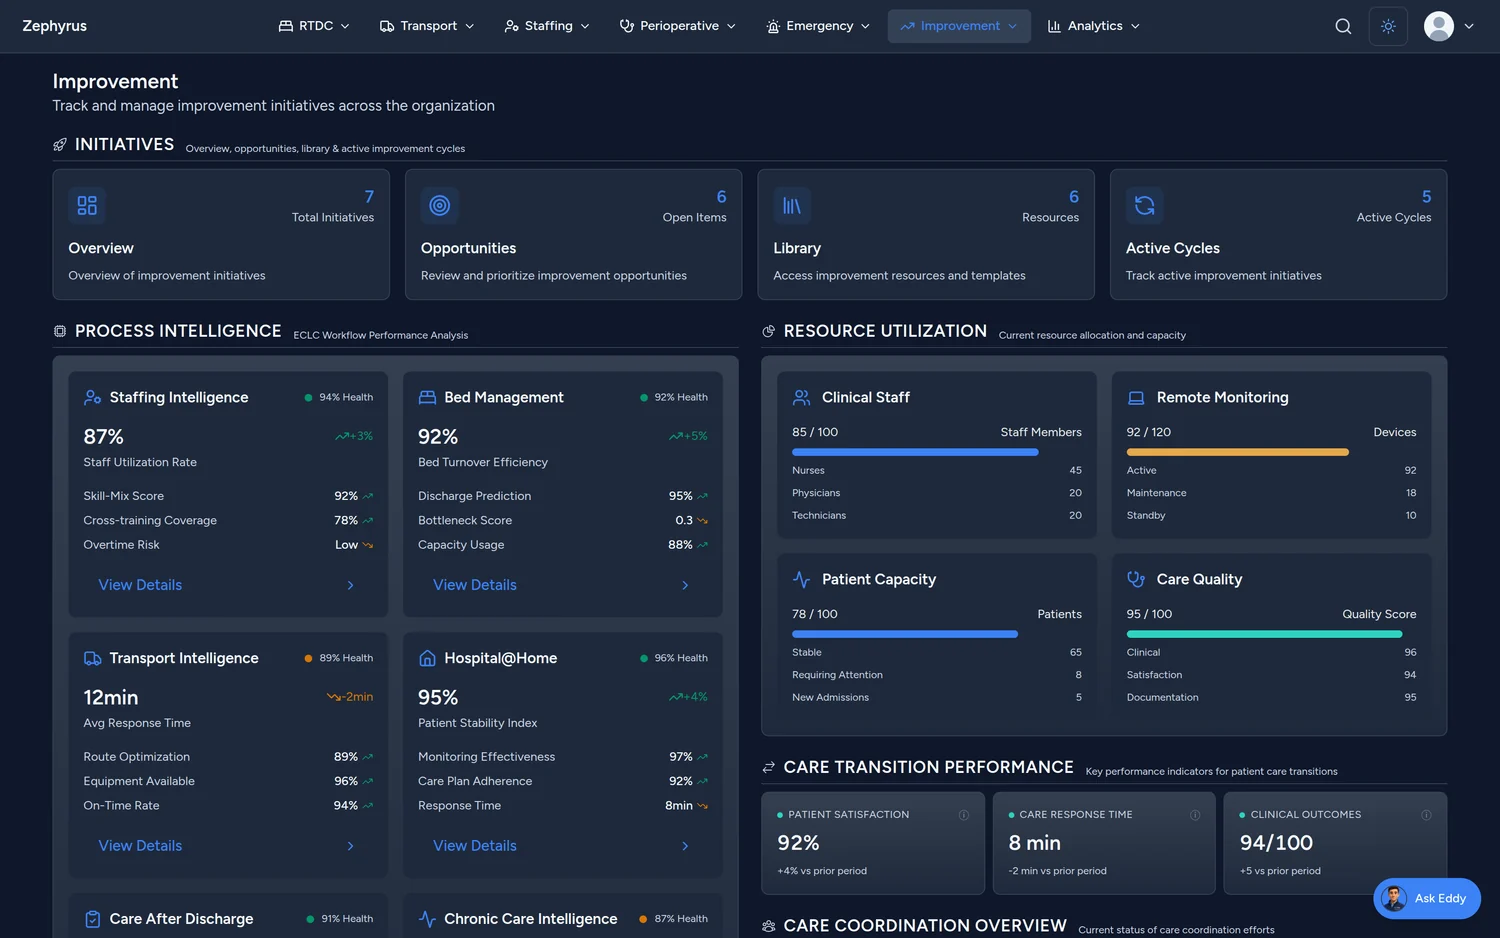
Real-time hospital operations at your command.
Zephyrus consolidates the workflows that usually live in five separate systems — Emergency Department, Real-Time Demand & Capacity, perioperative management, and nursing operations — into one command center with real-time dashboards and predictive signals. Designed to supplement your EHR over HL7 and FHIR, not replace it, so leaders can see where flow breaks down and act before a capacity crisis.
The Problem
Bed placement stretches for hours. Emergency Departments board admitted patients while ORs sit idle. Capacity is managed through manual huddles, spreadsheets, and siloed dashboards that show yesterday's data. Process-improvement work stalls for lack of visibility into where, exactly, the delay accumulates.
Zephyrus replaces reactive, fragmented operations with one real-time picture — showing where flow breaks down, predicting capacity constraints before they hit, and pointing teams at the specific bottleneck to fix.
Modules
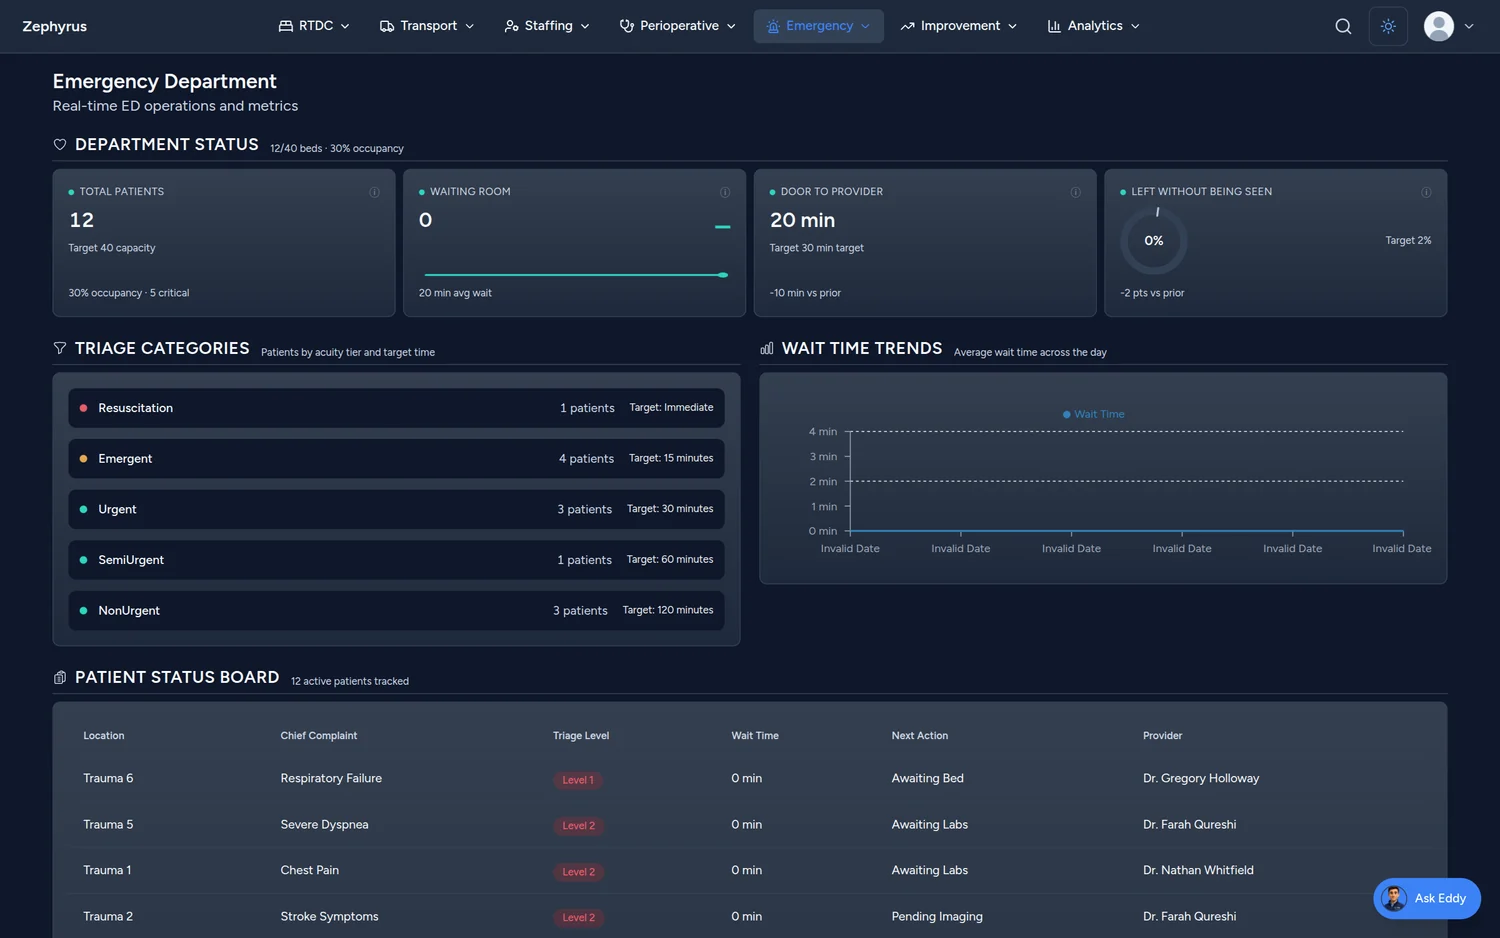
Live visibility into ED census by triage level, phase wait times (door-to-provider, triage-to-treatment, departure), and resource allocation — with a status board and trending to surface triage and staffing bottlenecks.
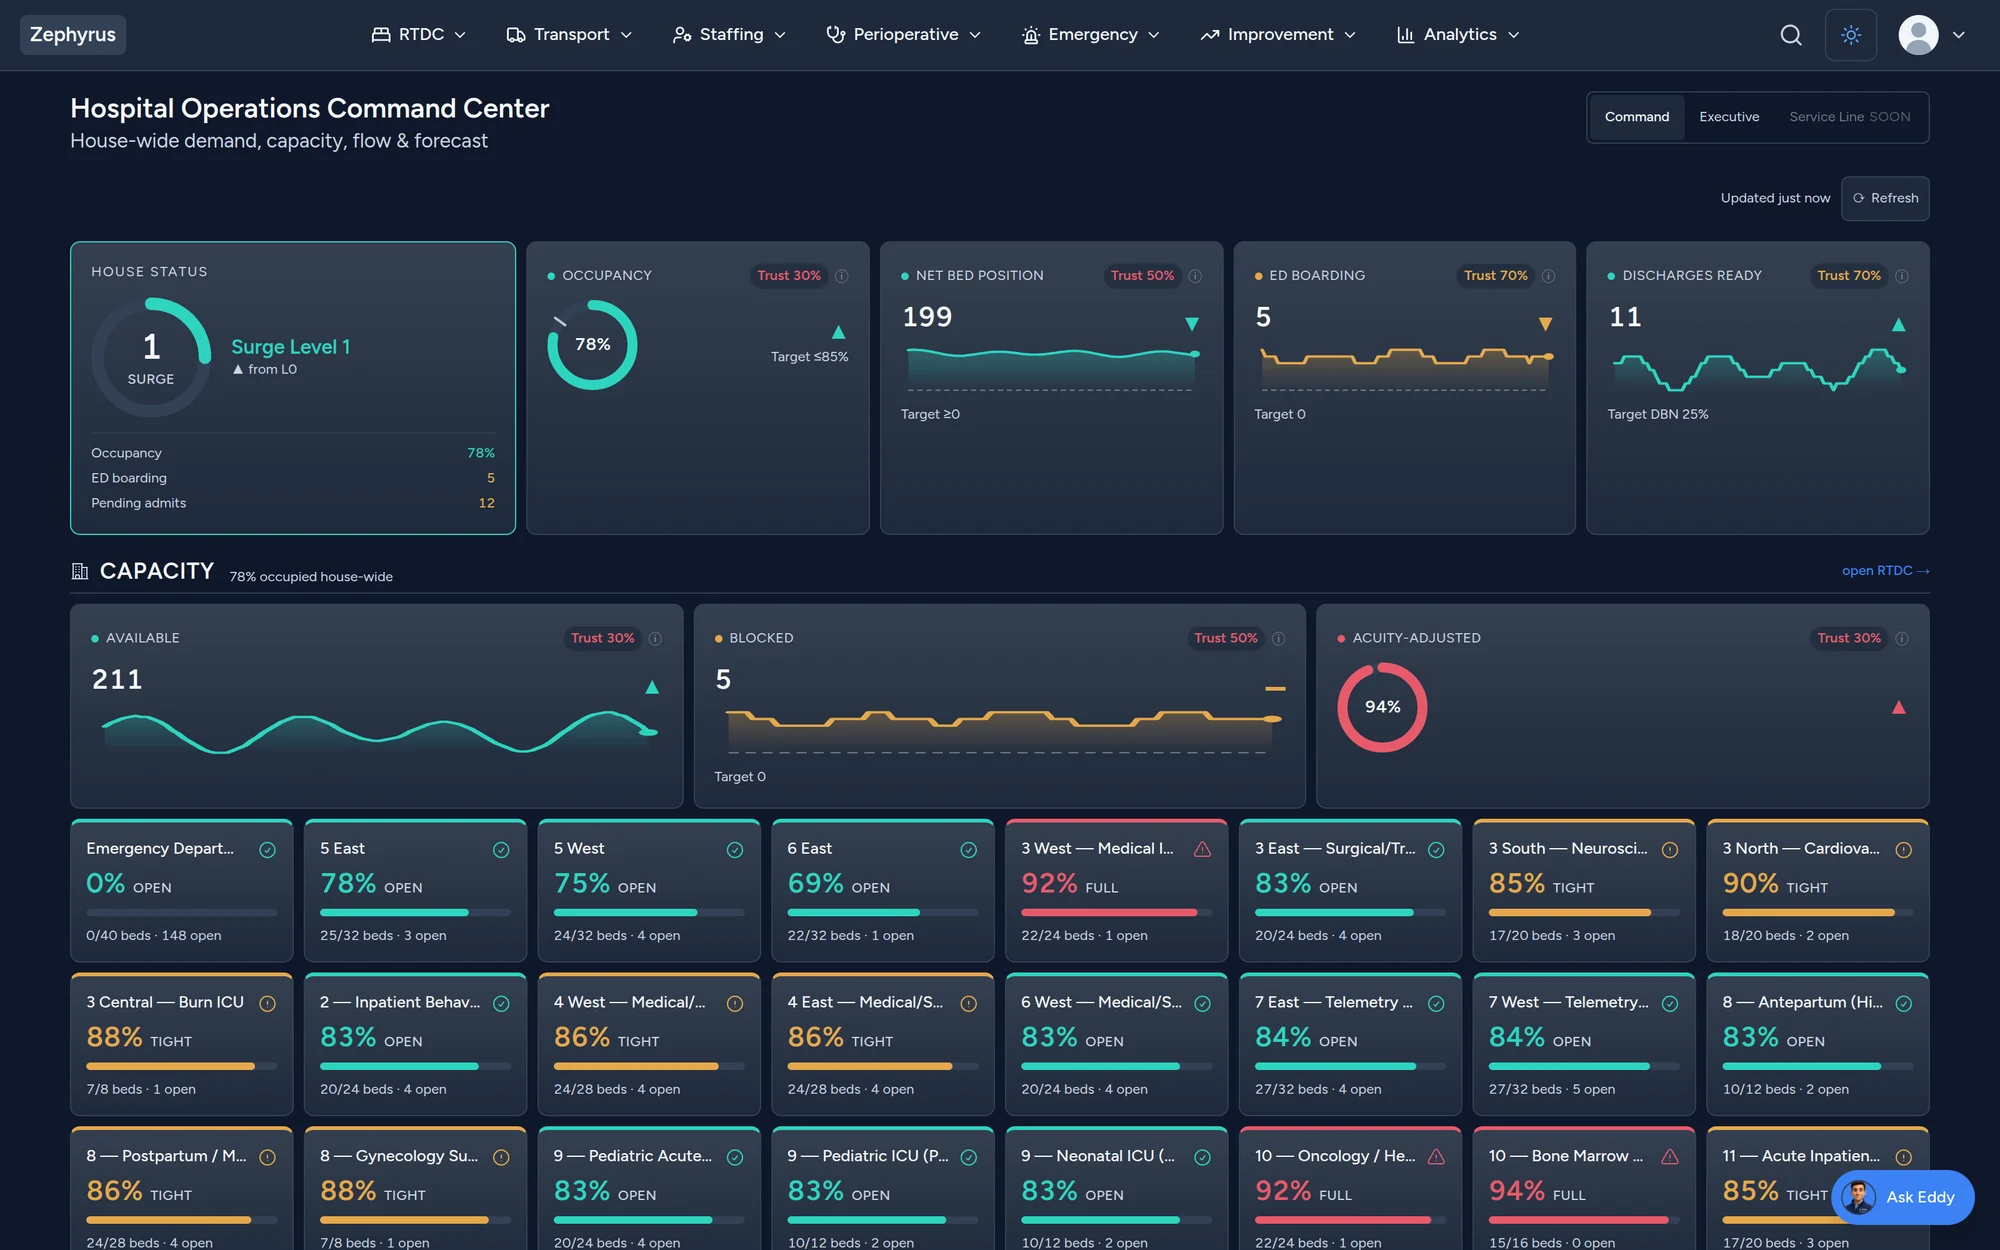
Hospital-wide bed tracking across unit types with real-time occupancy, discharge predictions, and pending admissions — plus red/yellow/green capacity status and department huddle views.
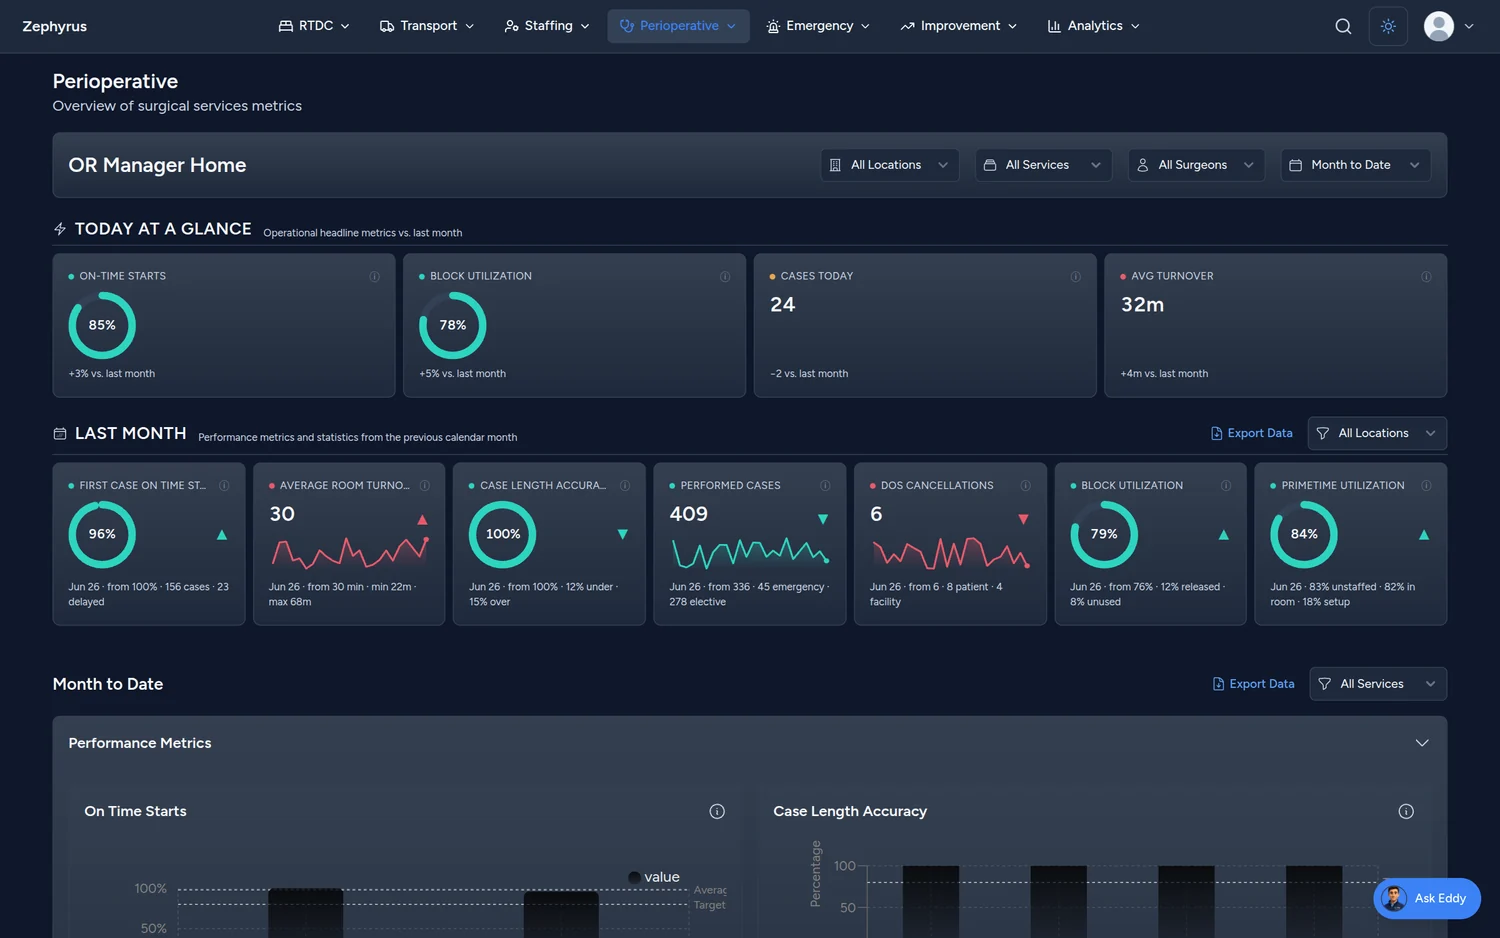
OR analytics across block utilization, prime-time utilization, and room-running — with case timing, turnover breakdowns, first-case on-time starts, and block-optimization recommendations.
Nurse-to-patient ratios by unit with variance from target, care-response times, and staffing demand forecasting — tied to length-of-stay and satisfaction signals.
Render care journeys (ED → Imaging → ICU → Discharge) as interactive diagrams with time-at-stage metrics, ranking bottlenecks by patient impact so teams can pilot a fix before scaling.
Threshold and forecast signals fire ahead of time — arrival surges, discharge backlogs, ICU census nearing capacity, OR turnover trending slow — scoped to each role.
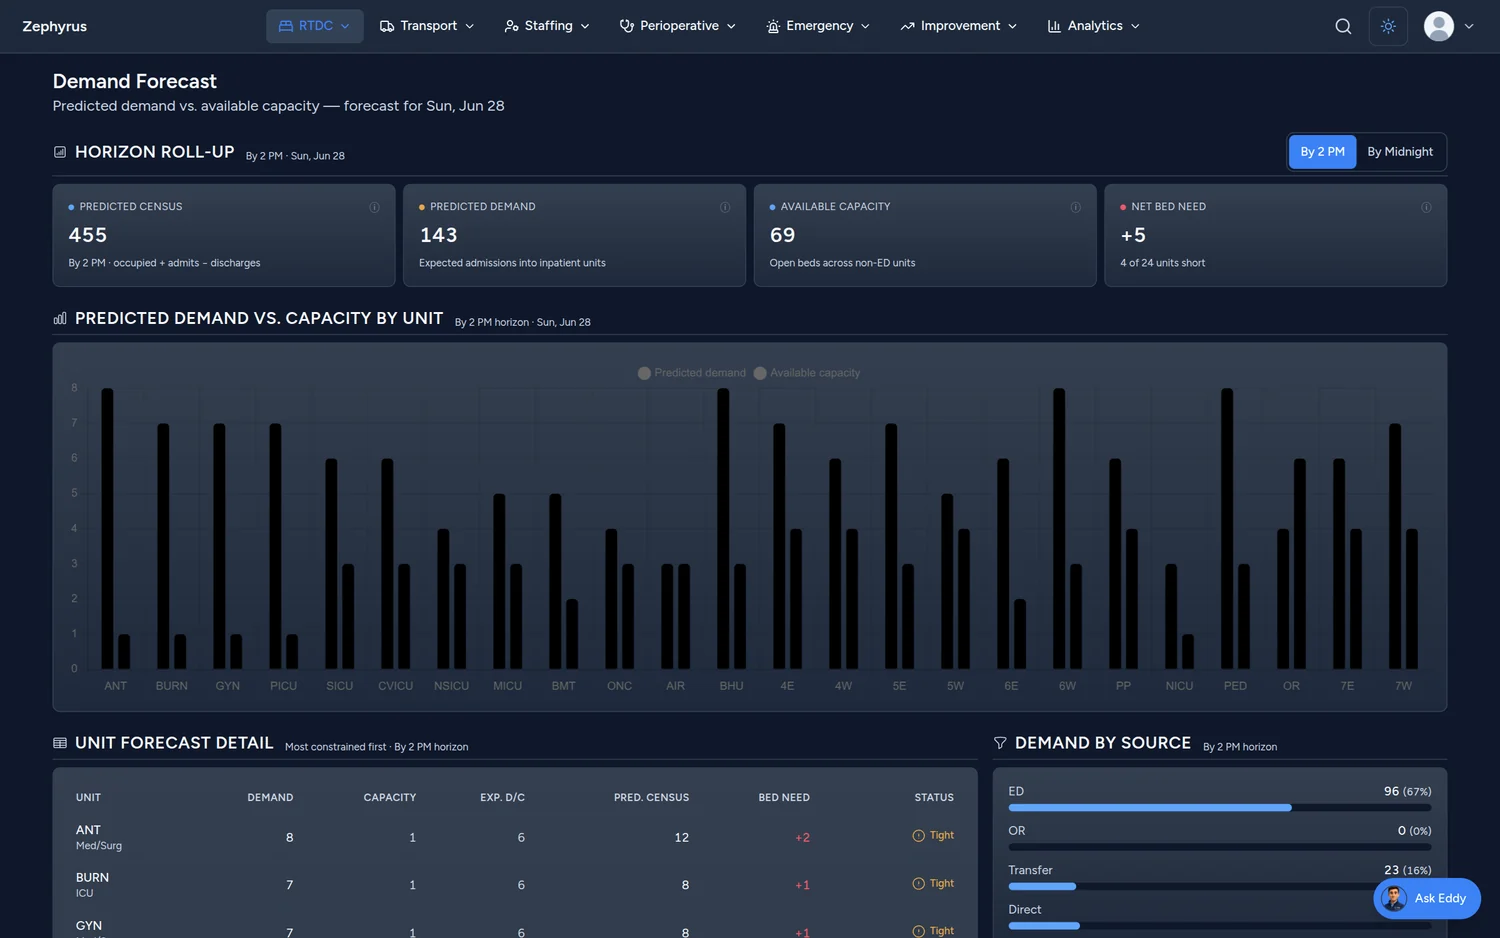
Project demand 24–72 hours out from scheduled surgeries, ED arrival patterns, and discharge timing — so capacity decisions happen before, not after.
Integrate satisfaction and quality signals (HCAHPS, readmissions, deterioration scores) and correlate them with operational data to quantify the cost of a delay.
Product Tour
From the live demo on Summit Regional, a synthetic 500-bed health system — click any view to enlarge.
Architecture
A component-driven UI bridged to Laravel by Inertia — no separate REST tax — with Nivo and Recharts visualizations and a command palette.
Controllers call services call repositories — clean separation, FormRequest validation, and Eloquent relationships with eager loading.
A layered design (raw → staging → prod → star → fhir) isolates ingestion from the application and from an analytics star schema.
Laravel broadcasting pushes live metric updates to connected dashboards, with polling fallback where WebSockets aren't available.
Roles scope every view — an ED director sees ED data, a surgeon sees their own cases — gated at route, resource, and row level.
Designed to ingest ADT/ORM feeds and FHIR R4 resources into the raw layer, transform in staging, and serve the app — coexisting with Epic, Cerner, or Meditech.
Who It's For
See door-to-provider trending up, identify imaging turnaround as the bottleneck impacting waiting patients, escalate discharge candidates, and watch left-without-being-seen fall over the shift.
Find the service running a low block utilization, drill into turnover broken down by cleaning, setup, and staffing, and reallocate time to a higher-utilization service — with first-case on-time starts as the scoreboard.
Get an early signal that ICU census will reach capacity in hours, initiate early discharge rounds, and avoid going on diversion — with the specific upstream bottleneck named.
Tie care-response times and discharge-documentation delays to length-of-stay and satisfaction, then target the one workflow that moves the metric.
Zephyrus productizes the real-time operational discipline of the Geisinger CDS Compendium — the MEWS early-warning program that scored vital deterioration continuously off the HL7 lane and escalated before the code, and the glucometrics worklist triaged daily. The same idea applied to flow: stream, score, act.
Read the CompendiumZephyrus is an actively developed platform with all four workflows rendering as functional dashboards in the live demo (on representative data). Production deployment connects the HL7/FHIR ingestion pipeline to your EHR and enables audit logging and encryption at rest — the architecture is built for it; the connectors are part of implementation, not a finished plug-and-play feature.
Under the Hood
FAQ
Explore the live demo, or talk to us about a Zephyrus deployment on your operational data.