Product Tour
See Parthenon in action
Every screen below is the live application running on a synthetic 1M-patient CDM — click any capture to enlarge.
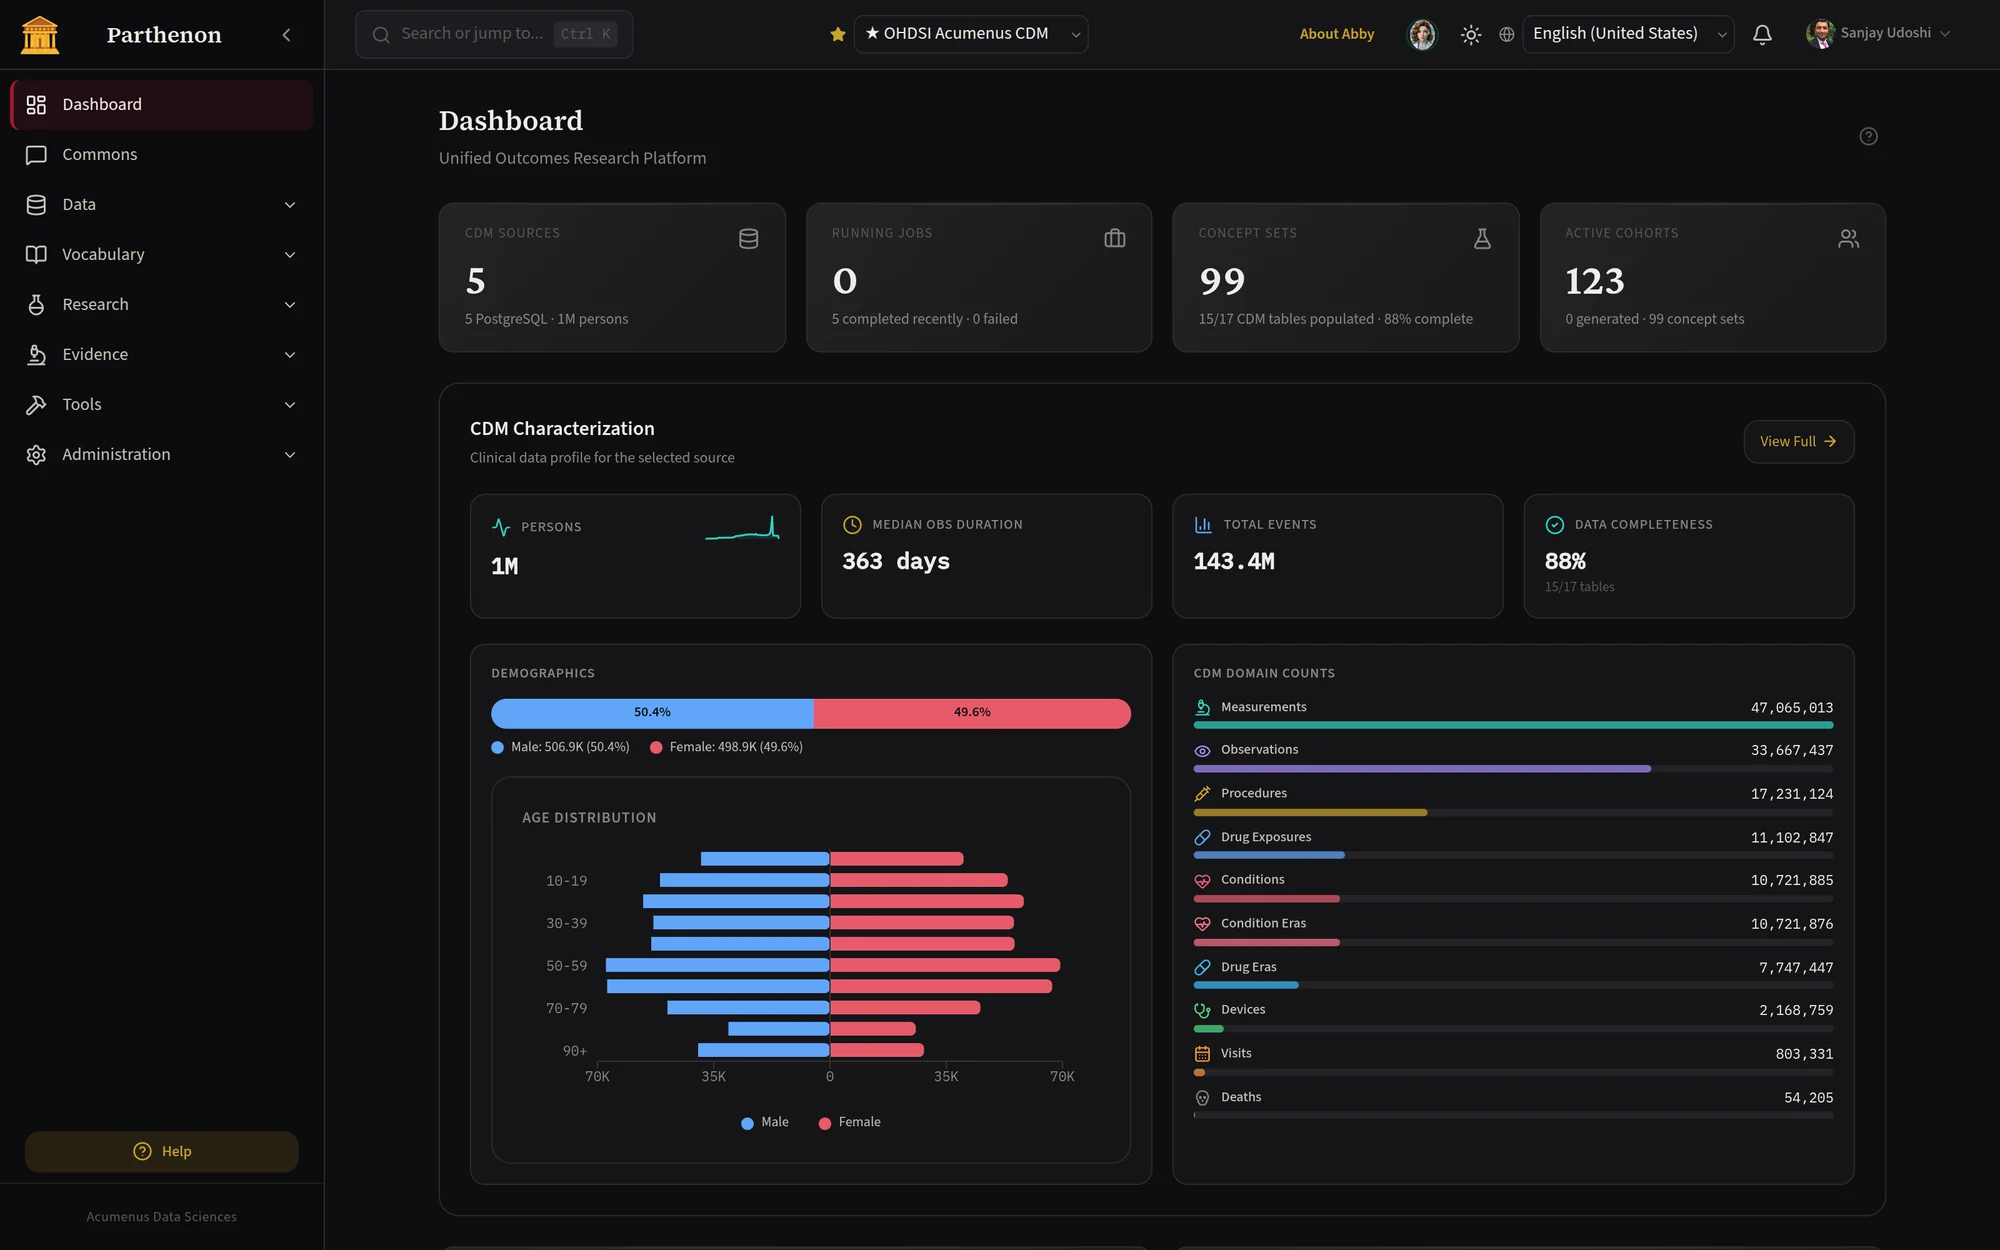
The unified OHDSI platform — one application replaces fifteen.
Parthenon consolidates the entire OHDSI toolchain — Atlas, WebAPI, Achilles, DataQualityDashboard, Usagi, WhiteRabbit, CohortMethod, PatientLevelPrediction, and more — into a single, modern application built on Laravel 11, React 19, and OMOP CDM v5.4. One login, one Docker stack, one cohort builder that flows naturally into characterization, incidence, treatment pathways, prediction, and effect estimation — without ever switching tools.
The Problem
Running a real-world evidence study with the classic OHDSI stack means juggling ten-plus separate applications — each with its own install, credentials, UI idiom, and learning curve. A single question — "What is the incidence of stroke in newly treated hypertensives?" — forces a researcher to hop between Atlas for the cohort, WebAPI for the SQL, Achilles for characterization, DataQualityDashboard for validation, and R packages for estimation.
Every tool jump introduces friction: auth failures, version drift, context switching. For health systems, the sprawl multiplies — Java containers, .NET services, R runtimes, and a decade-old Knockout.js front end to keep alive. Data engineers spend more time wrangling tools than wrangling data. Parthenon eliminates that friction entirely.
Capabilities
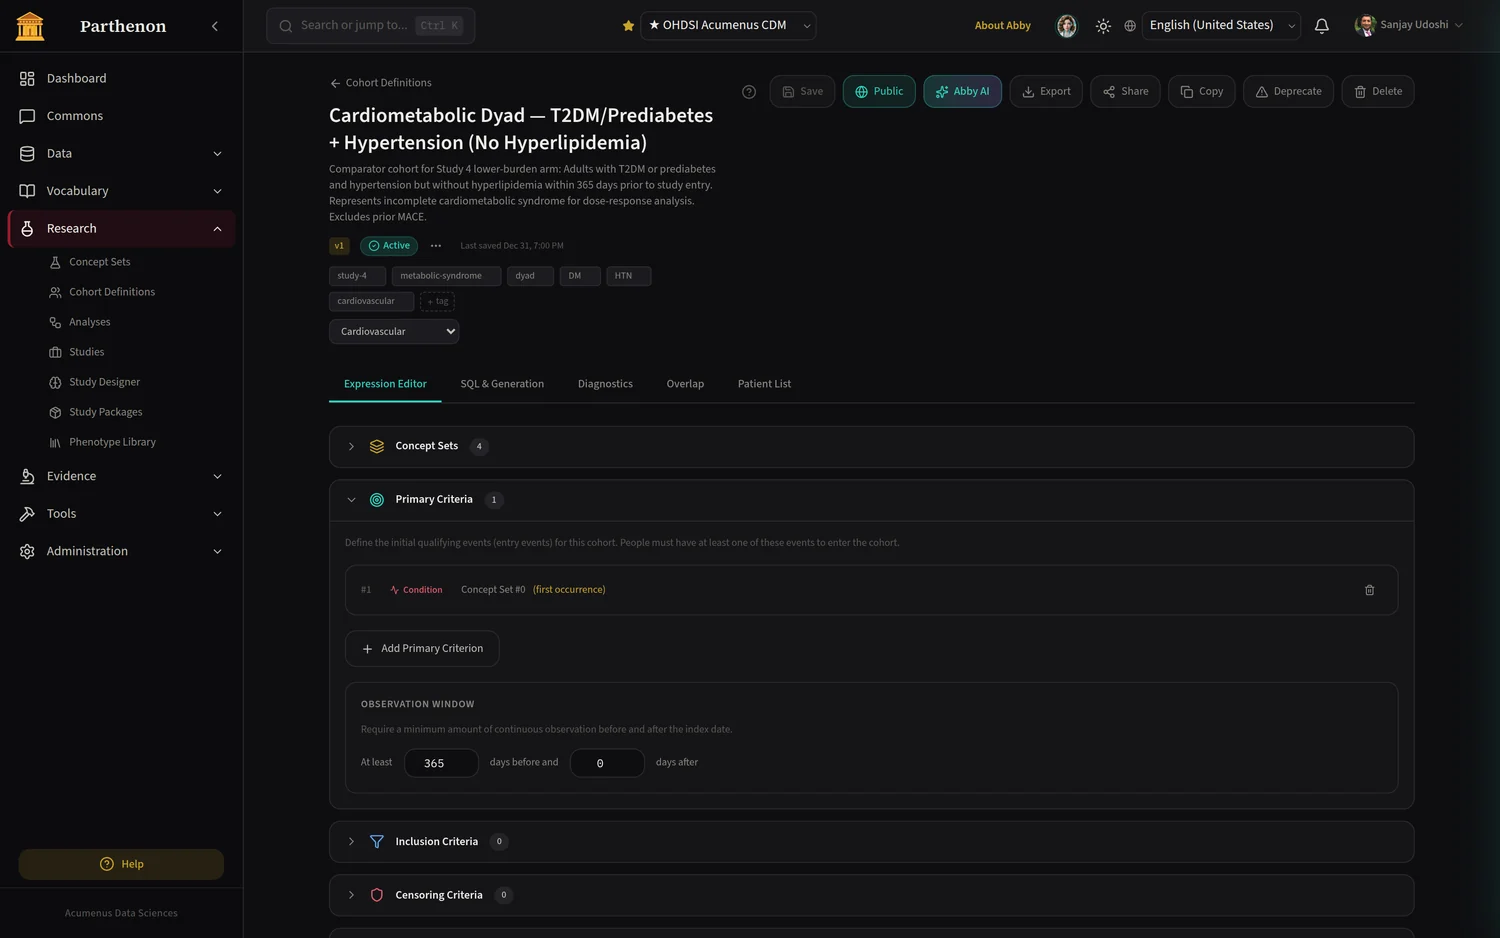
A drag-and-drop editor matching the Circe expression format used in Atlas — so existing cohort definitions import without modification. Real-time SQL preview shows exactly what runs, with live person-count feedback against any registered CDM source.
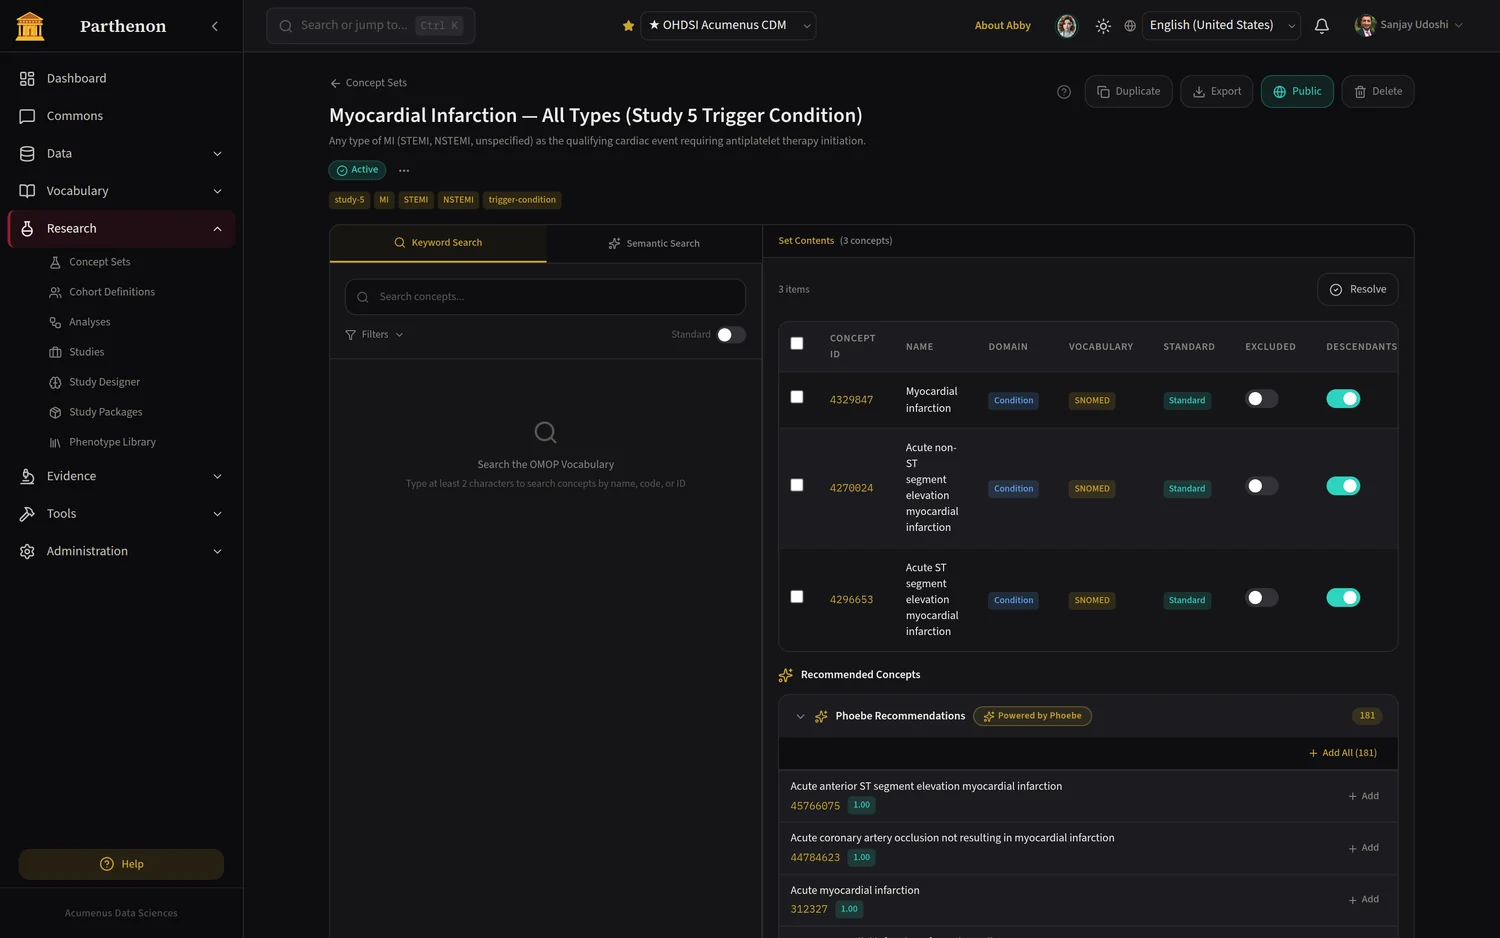
Search 7M+ OMOP concepts by name, code, or synonym. Navigate SNOMED / RxNorm / LOINC ancestor-descendant trees, inspect source-to-standard mappings, and build concept sets with descendant expansion and AI-powered semantic search.
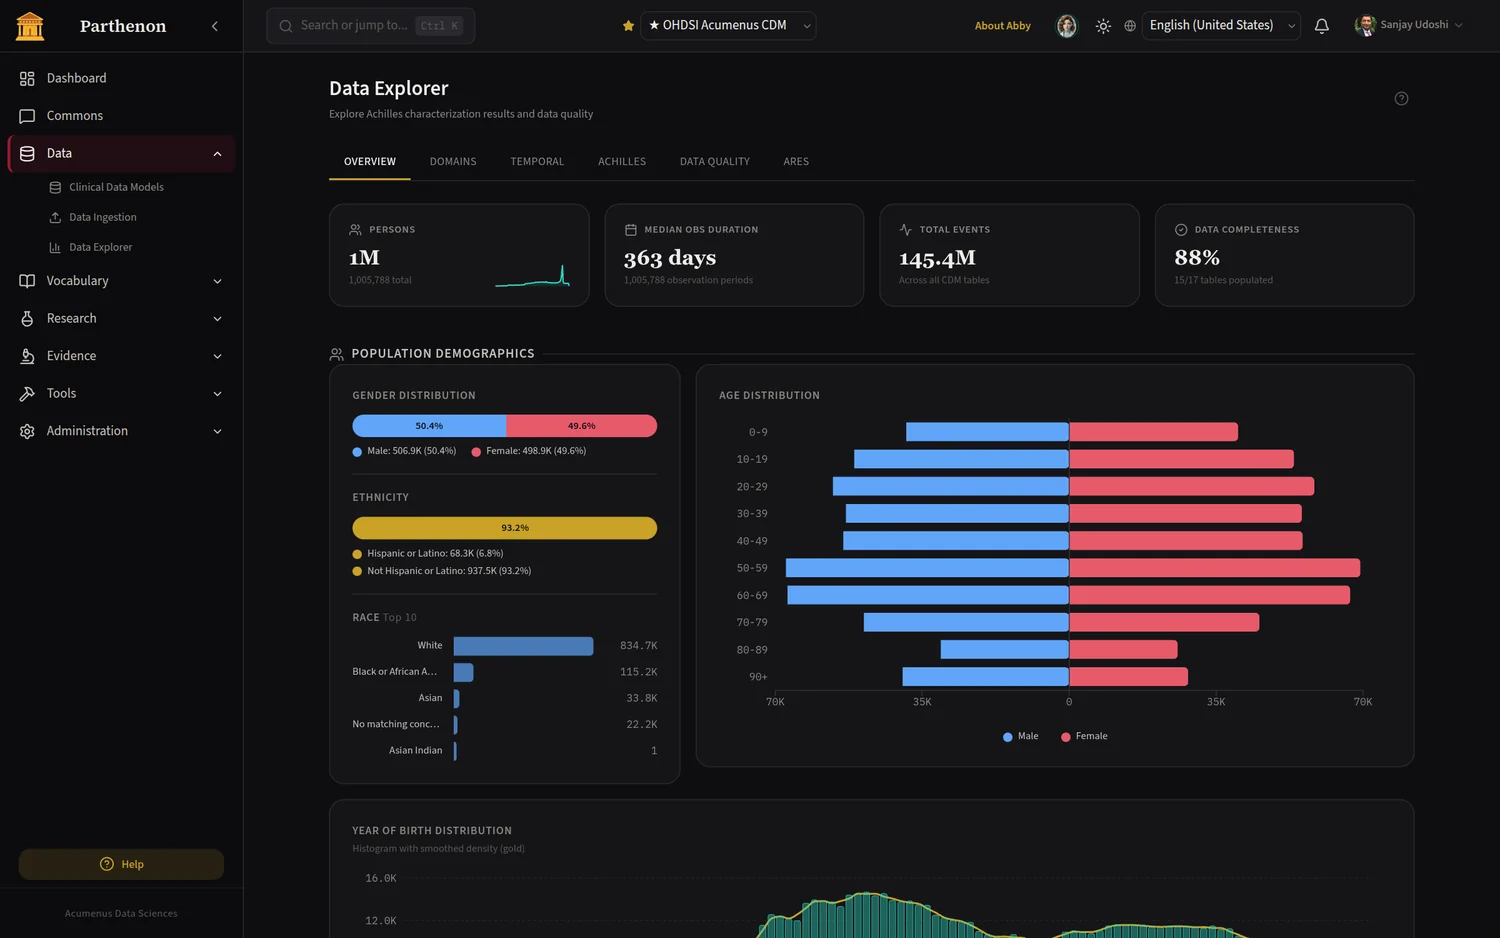
A full Achilles characterization engine (~200 analyses) and DataQualityDashboard (~3,500 checks) built in — no R installation required. Record counts, demographic distributions, temporal trends, and HEEL violations across every domain, interactively.
Compute crude and adjusted incidence rates with time-at-risk windows and gender/age/calendar stratification. Visualize real-world treatment pathways as Sankey diagrams to see the sequences patients actually follow.
Patient-level prediction (PatientLevelPrediction) and population-level estimation (CohortMethod) run as managed R sidecars. Submit from the UI, monitor execution, and view ROC curves, calibration, and forest plots — without touching R.
Beyond classic OHDSI: upload VCFs for variant annotation, browse variants interactively, and view DICOM studies in an embedded OHIF / Cornerstone3D viewer — with imaging and genomic criteria usable inside cohort expressions.
Upload CSVs or FHIR bundles and the pipeline profiles the schema, suggests OMOP mappings with confidence scores, and stages a human review queue before writing to the CDM — replacing WhiteRabbit, Usagi, and hand-rolled ETL.
Pre-built care bundles with constituent gap measures evaluate any population for per-patient gap status and bundle compliance — plus health-economics analytics for value-based programs.
Describe a cohort in plain English and Abby generates the structured OMOP expression; ask it to explain any cohort, search concepts semantically, or interpret a result. Bring your own model — Ollama / MedGemma by default, with 8 providers supported.
Product Tour
Every screen below is the live application running on a synthetic 1M-patient CDM — click any capture to enlarge.
Architecture
A single Docker Compose stack orchestrates the application, AI, analytics, and search services around one OMOP database.
Feature-modular front end (cohorts, vocabulary, analyses, studies, data explorer, imaging, genomics) with TailwindCSS, Zustand, and TanStack Query.
A typed PHP 8.4 REST API with Sanctum auth, Spatie RBAC, Horizon job queues, and an auto-generated OpenAPI spec + TypeScript SDK.
OMOP CDM v5.4 clinical and vocabulary tables, an application schema, and pgvector for embeddings — with Redis for cache and queues.
CohortMethod, PatientLevelPrediction, and SCCS run in managed R containers via a Plumber API — results stream back to the UI.
A FastAPI service backs Abby: natural-language cohort generation, concept embeddings, and semantic search via Ollama / MedGemma.
Solr powers faceted concept and cohort search; Orthanc + OHIF handle DICOM storage and 3D image viewing.
Who It's For
Import an existing Atlas cohort, run Achilles to understand data quality, characterize target and comparator populations, then dispatch a CohortMethod estimation to an R sidecar — and export the cohort, plan, and forest plot for a manuscript, without the context-switching of separate tools.
Onboard a new EHR export: the ingestion pipeline profiles the schema, suggests OMOP mappings with confidence scores, and stages uncertain mappings for review. Approve, write to the CDM, then validate with built-in Achilles and DQD — replacing WhiteRabbit, Usagi, and custom SQL.
Evaluate a diabetes care initiative against tens of thousands of patients using pre-built bundles, drill into per-clinic gap rates, and export a population dashboard for quarterly review — no R, no Atlas, just point and click.
Keep Atlas artifact compatibility for legacy R workflows while moving the team onto a modern UI — design protocols, run cohorts locally, and report aggregate counts without moving PHI.
Why It's Different
| Dimension | Legacy OHDSI | Parthenon |
|---|---|---|
| Tools | 10+ separate apps | One application |
| Auth | Per-tool credentials | Single sign-on, one RBAC model |
| Front end | Knockout.js (2010s) | Modern React 19, responsive |
| Characterization | R Achilles, offline | Built in, no R required |
| Ingestion | WhiteRabbit + manual Usagi | AI pipeline with review queue |
| AI assistance | None | Abby copilot, 8 providers |
| Imaging / genomics | Not supported | DICOM viewer + variant browser |
| Install | Hours (Java, R, Node) | One Docker command |
Parthenon's analytics core descends directly from the work documented in the Geisinger CDS Compendium — the conformed dimensional model, the rules engine, and the 410+ evidence-based measures that powered care for 620,000 patients a day. Parthenon makes that discipline reproducible: open-source, standards-based, and runnable by any health system or research center.
Read the CompendiumUnder the Hood
FAQ
Explore the live demo on synthetic data, or talk to us about deploying Parthenon on your OMOP database.